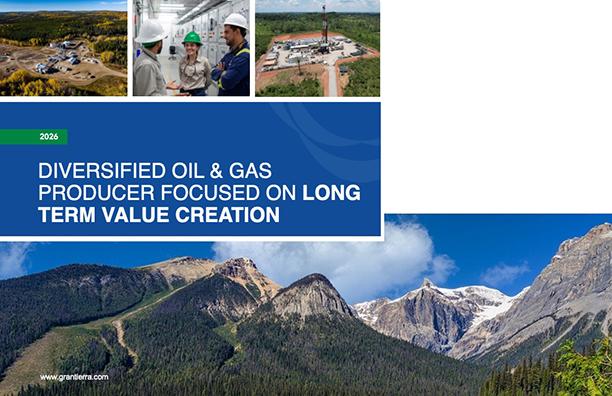
Strong Balance Sheet and Diversified Production Mix
Balance Sheet Strength
Strong reserve metrics with 78 MMBOE PDP, 131 MMBOE 1P, 234 MMBOE 2P and 329 MMBOE 3P, with 1P & 2P reserve lives1 of 8 and 14 years, respectively.
Diversified Production Mix
Well positioned for long-term commodity cycles with 18% of Gran Tierra’s production attributed to natural gas while maintaining exposure to international oil prices.
Commitment to Increase Stakeholder Value
Strong focus on generating free cash flow and ongoing debt reduction. Since January 1st, 2022, Gran Tierra has repurchased approximately 7.5 million shares or 22% if its outstanding shares. Additionally, Gran Tierra has repurchased US$21 million of its 2029 notes during 2025.
SWIPE FOR MORE
GTE is poised to capitalize on emerging opportunities and deliver value to all our stakeholders.
The Company has strong reserve metrics with 78 MMBOE PDP, 131 MMBOE 1P, 234 MMBOE 2P and 329 MMBOE 3P, with 1P & 2P reserve lives1 of 8 and 14 years, respectively.
High Impact Catalysts in 2026
- Successful exchange of 9.5% Senior Secured Amortizing Notes due 2029, with approximately 89% participation
- Development drilling program in Suroriente, Ecuador
- Completed all 2025 Ecuador exploration commitments, enabling a strategic shift toward free cash flow generation and portfolio value optimization
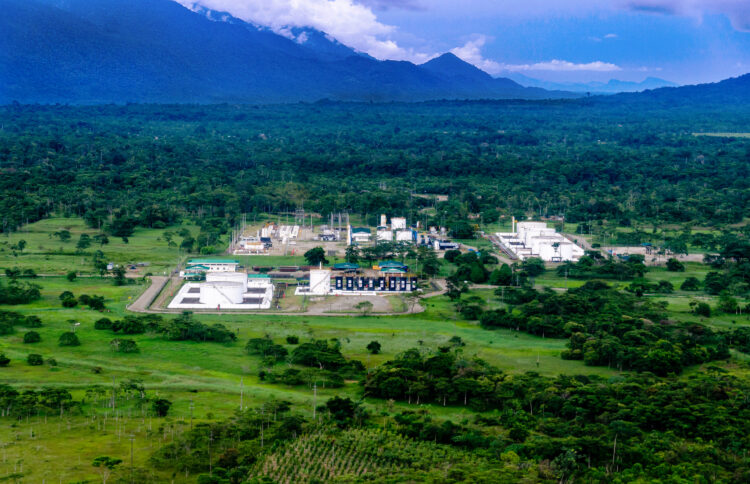
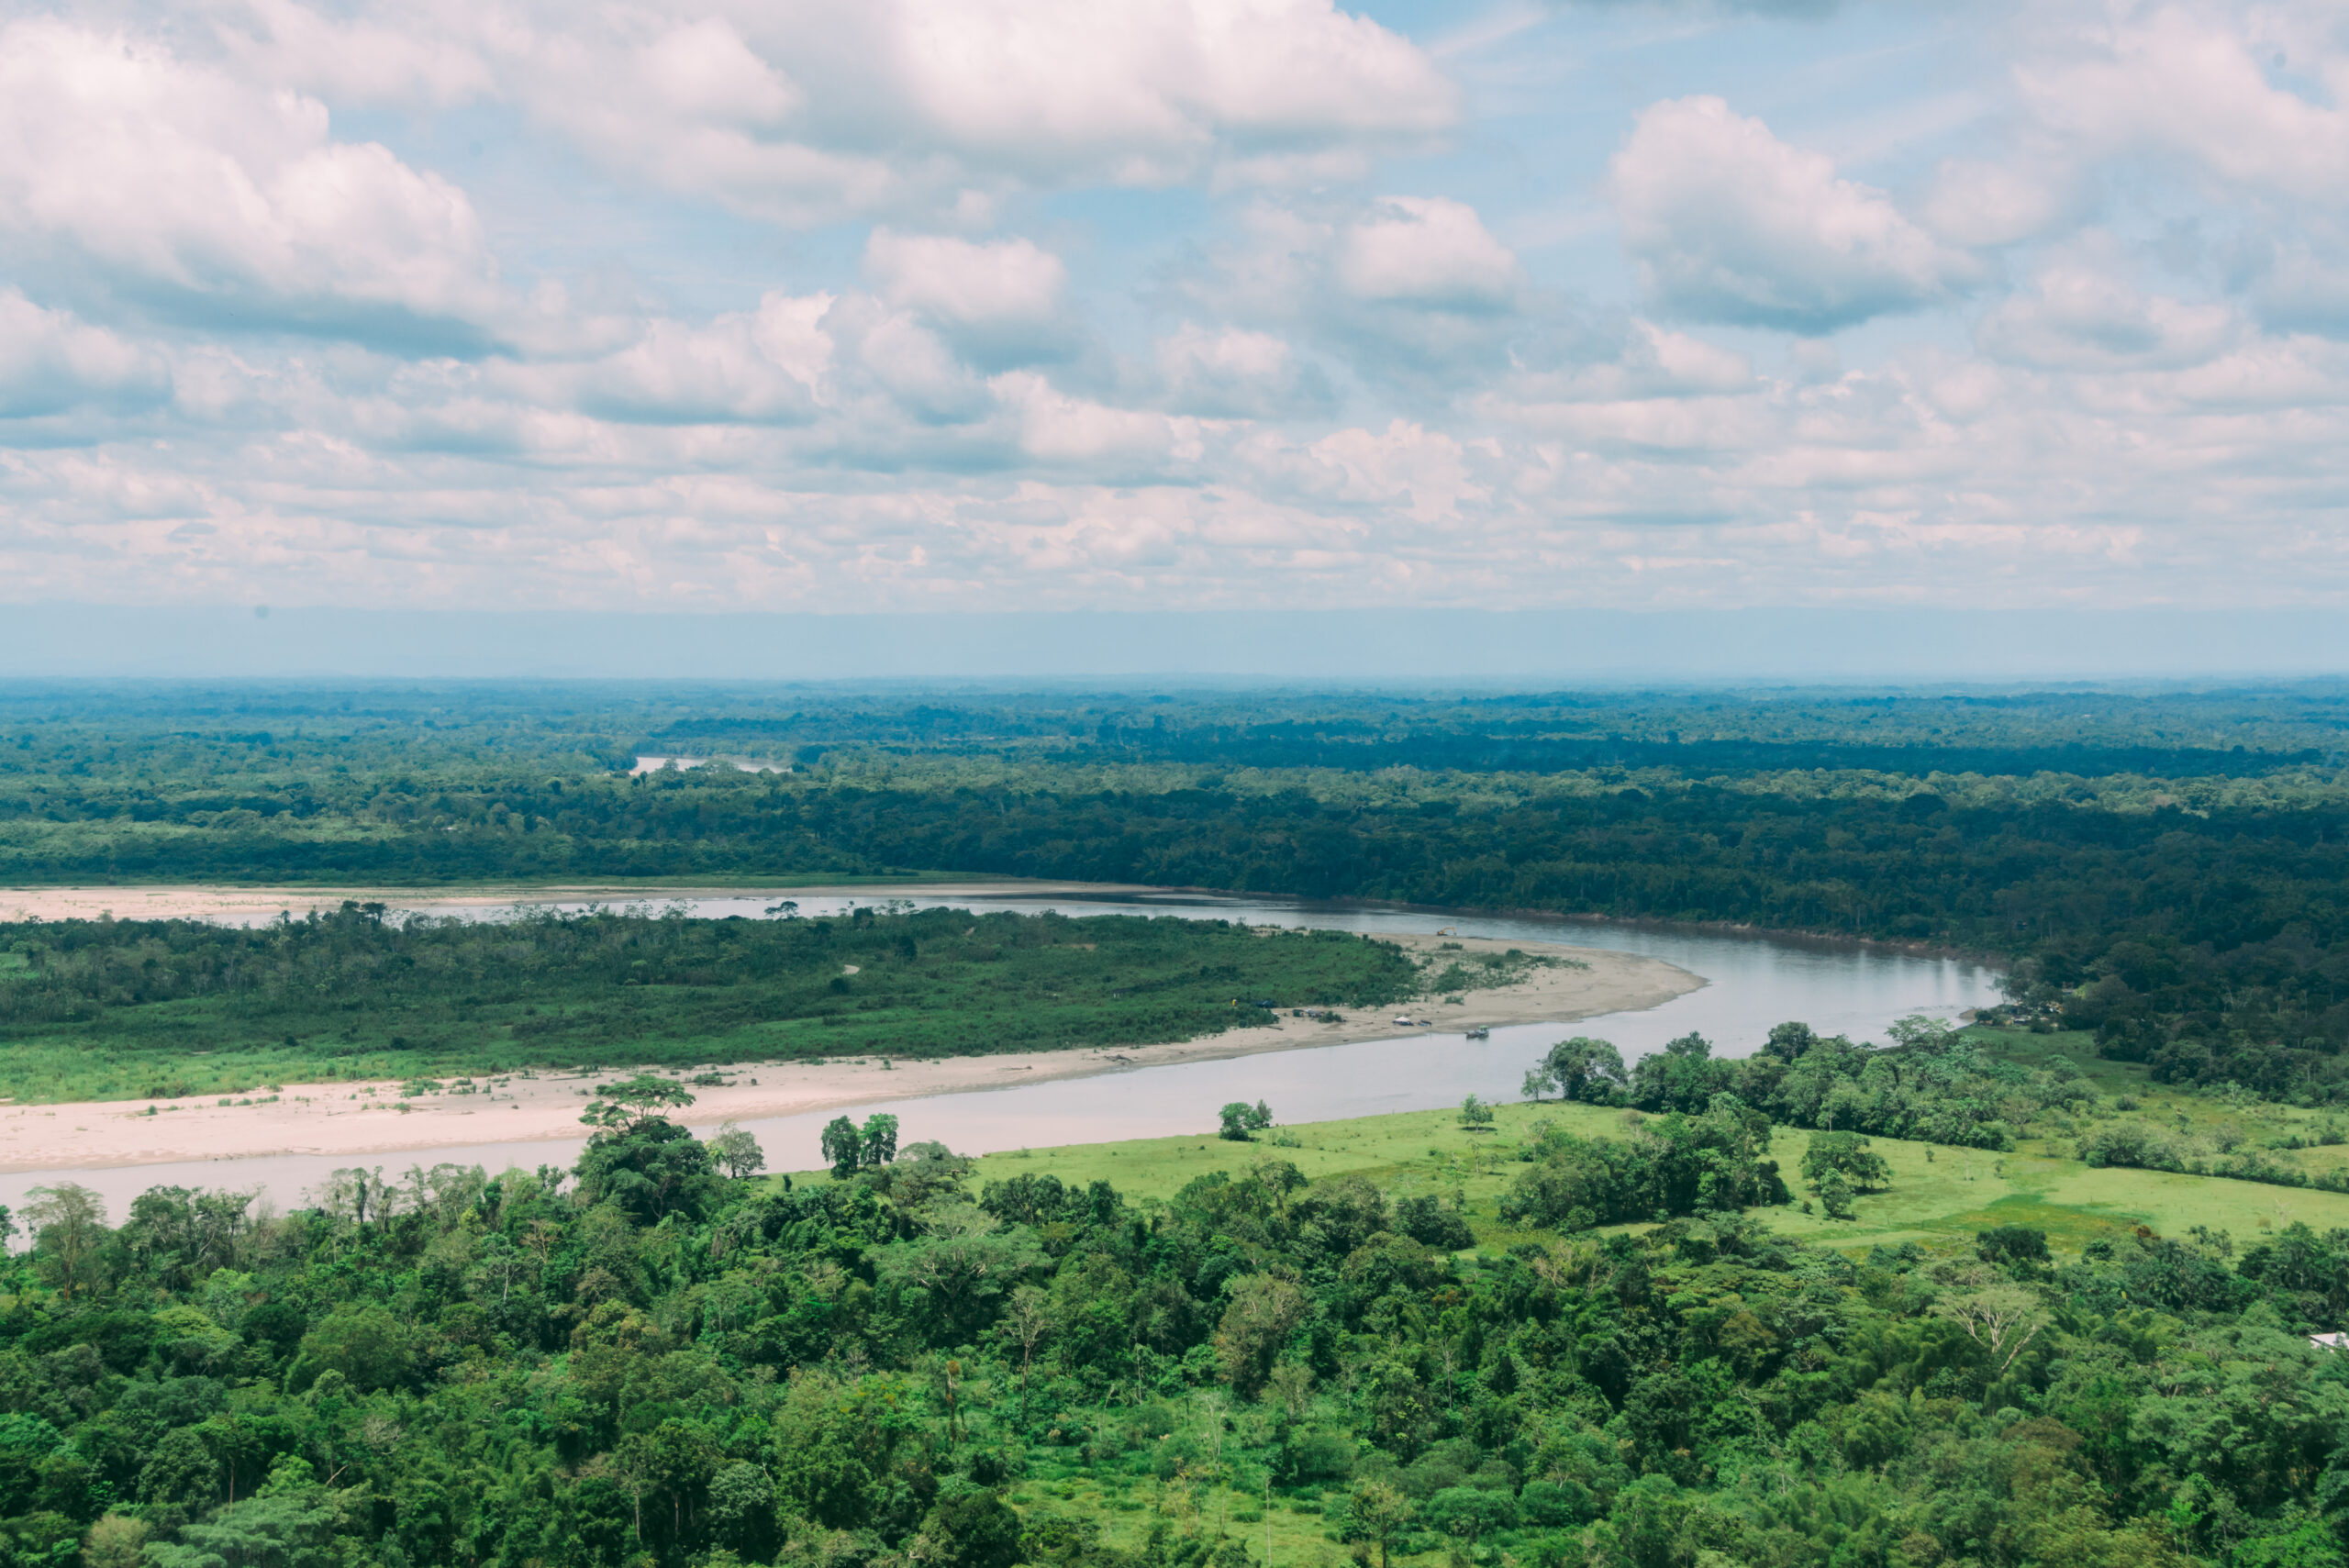
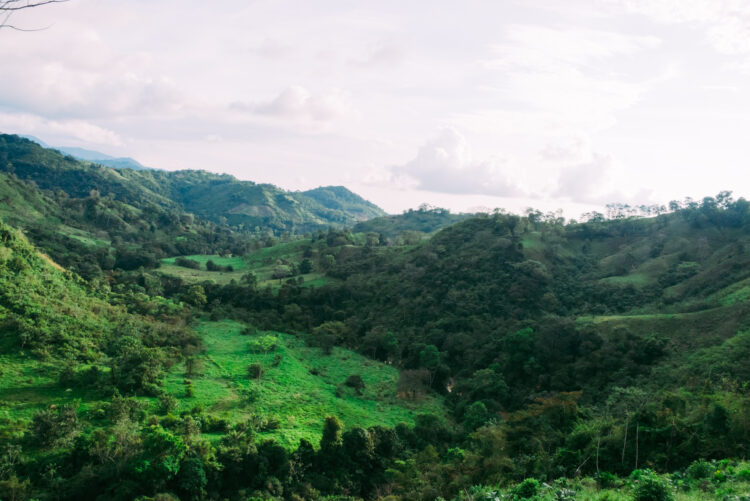
Environmental Stewardship
Gran Tierra stands proudly as an industry leader in Environmental Stewardship, both in its compliance with regulations and international best practices, and through its voluntary initiatives that address local, national and international environmental issues. GTE has maintained its long-term commitment to support healthy environments and prosperous, informed communities.
+0M
trees
In Colombia, GTE has planted over 1.9 million trees and conserved, preserved or reforested over 5,600 hectares of land
~0%
FLARING REDUCTION
Since 2019, GTE has reduced our flaring emissions by ~75% companywide
SWIPE FOR MORE
More About Sustainability
Who is Gran Tierra Energy?
Full Cycle Company
Focused to reinvesting in the business to meet the worlds growing energy demand by exploring, developing and optimizing its portfolio
Seventh consecutive year of South American reserves growth with over 100% PDP & 2P reserve replacement
Focus on Free Cash Flow
Prudent utilization of free cash flow to generate long-term value
Since January 1st, 2022, Gran Tierra has repurchased approximately 7.5 million shares or 22% if its outstanding shares
Diversified
Acquisition of i3 Energy diversifies geographically into Canada, while also adding natural gas and NGL production
Strong asset portfolio offers an attractive mix of growth and mature assets that are regionally diverse
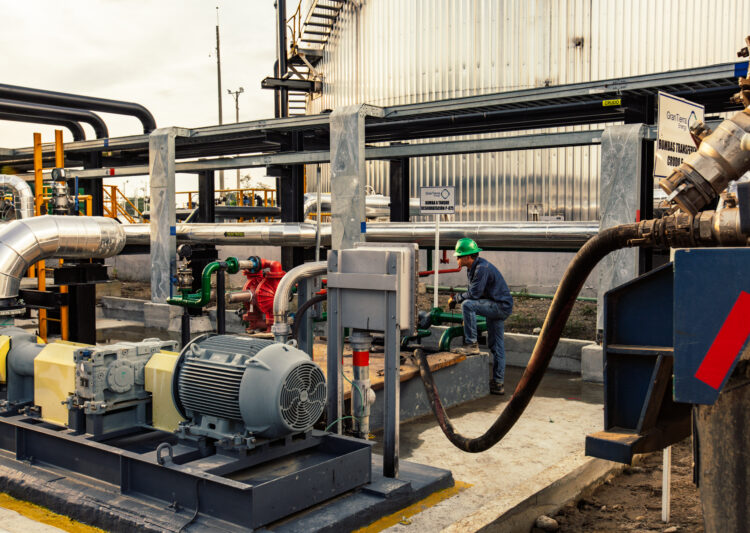
Low-Cost Operator
Focused on continuous improvement
Driving down costs through innovation and technology driving down drilling, completion and operating costs
Leaders in Sustainability
Top quartile safety performance
Social license to operate through active engagement and investment in areas of operations
SWIPE FOR MORE
-
VIEW FOOTNOTES
-
1) Per GTE McDaniel December 31, 2025, Reserves Report, with Simonette reserves removed in connection with the disposition of Simonette assets.
Corporate Presentation
-
DISCLAIMERS
-
Disclaimer – Gran Tierra Energy Inc.
The information provided on this website is for informational purposes only and does not purport to be comprehensive or contain all the details that readers may require. You are encouraged to conduct your own analysis and review of Gran Tierra Energy Inc. (“Gran Tierra”, “GTE”, or the “Company”) and the information presented here. Without limitation, you should review the Company’s publicly filed documents, seek the advice of financial, legal, accounting, tax, and other professional advisors, and consider relevant factors before making any decisions regarding the Company.
Gran Tierra does not authorize any third party to provide additional or different information. Any such unauthorized information, including statements made in media articles about the Company, should not be relied upon. No representation or warranty, express or implied, is made by Gran Tierra as to the accuracy or completeness of the information contained on this website. Nothing provided herein constitutes a promise or representation by Gran Tierra.
Investment and Risk Advisory
Investing in securities of Gran Tierra is speculative and involves a high degree of risk. The Company operates within the oil and gas industry and faces various risks associated with exploration, production, geopolitical factors, market volatility, and regulatory changes. An investment in the Company’s securities is suitable only for investors who can bear the risk of losing some or all of their investment. Potential investors should carefully review the risks outlined under the “Risk Factors” section in the Company’s Annual Report on Form 10-K and other filings available at www.grantierra.com.
Financial and Performance Information
Any financial outlooks or projections included on this website are for illustrative purposes only and are based on management’s best estimates and available data at the time of publication. These projections involve various assumptions about future events, economic conditions, commodity pricing, and operational outcomes. Actual financial and operational results may differ significantly from these projections.
Users should not rely solely on the information presented here and should conduct their own due diligence. For official financial disclosures and performance updates, please refer to Gran Tierra’s press releases and regulatory filings. By accessing this website, you acknowledge and agree to the terms of this disclaimer. If you do not agree, you should refrain from using the information provided.
Disclaimer – Presentation of Oil & Gas Information
The information provided on this website regarding oil and gas operations, reserves, and metrics is for informational purposes only and may not provide all the details necessary for an in-depth evaluation. Readers should review the Company’s publicly filed documents and consult with financial, legal, and professional advisors before making investment or business decisions.
Barrel of oil equivalents (“BOEs”) are presented using a conversion ratio of six thousand cubic feet (“Mcf”) of natural gas to one barrel of oil. This ratio is based on energy equivalence and does not reflect economic value at the wellhead. As a result, BOEs may be misleading, particularly if used in isolation. Production figures are reported on a working interest (WI) basis (operating and non-operating) before royalty deductions, unless otherwise specified. Per BOE amounts are calculated based on WI sales before royalties.
References to formations where evidence of hydrocarbons has been encountered do not guarantee commercial recovery of hydrocarbons in any estimated quantity. Gran Tierra’s reported production is a mix of light, medium, and heavy crude oil, and its sales volumes often represent blends of more than one product type. Preliminary well test results and well log interpretations should not be relied upon as indicators of long-term performance or ultimate recovery unless confirmed through further analysis.
Definitions and Terms
- 1P, 2P, 3P: Represent different classifications of reserves: Proved, Proved plus Probable, and Proved plus Probable plus Possible reserves, respectively.
- Reserves: Quantities of oil, natural gas, and related substances recoverable from known accumulations under reasonable economic conditions.
- Reserve life index: Calculated as reserves in the referenced category divided by the referenced estimated production. Management uses this measure to determine how long the booked reserves will last at current production rates if no further reserves were added.
For further information regarding oil and gas definitions, refer to Canadian National Instrument 51-101 (“NI 51-101”), CSA Staff Notice 51-324, and the Canadian Oil and Gas Evaluation Handbook (“COGEH”).
Reserves Information
Unless otherwise indicated, all reserves values, future net revenue, and related metrics referenced on this website reflect values as of December 31, 2024, based on the GTE McDaniel December 31, 2024 Reserves Report, prepared by McDaniel & Associates Consultants. Additional information regarding reserves data can be found in Gran Tierra’s publicly filed Statement of Reserves Data and Other Oil and Gas Information on Form 51-101F1 at www.sedarplus.com.
Estimates of reserves are subject to various uncertainties and may not reflect actual recoverable quantities. Variations between estimated and actual reserves may be material, and reserve estimates do not necessarily represent fair market value. Future net revenue estimates are based on forecast prices and development costs but exclude indirect costs such as administrative expenses.
Oil and Gas Metrics
This website may contain oil and gas metrics such as free cash flow, reserve life index (RLI), net asset value per share (NAV), and reserves replacement. These metrics may not have standardized definitions and may not be comparable to similar measures used by other companies. Management uses these metrics to evaluate performance, but they are not reliable indicators of future performance. Readers should not rely solely on these metrics for investment decisions.
For further information and disclaimers on the above measures and metrics refer to the Appendix to our Corporate Presentation.