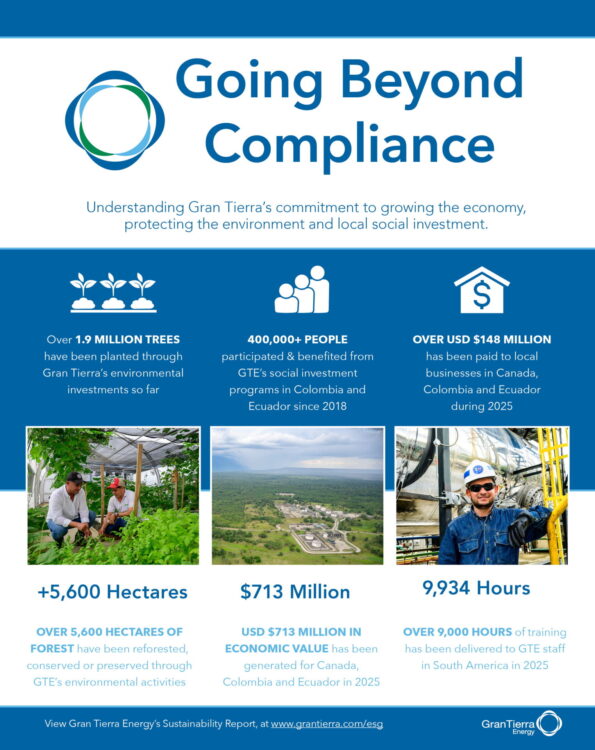
Gran Tierra Energy is committed to providing meaningful opportunities for economic growth, community development, prioritizing local goods and services and maximizing our social and environmental investments through our philosophy of working Beyond Compliance. We attach great importance to the Company’s approach to managing Environmental, Social and Governance (ESG) factors that are material to the business.
The following reports highlight our transparent strategies to protect the environment, support local communities, and operate in a responsible way.
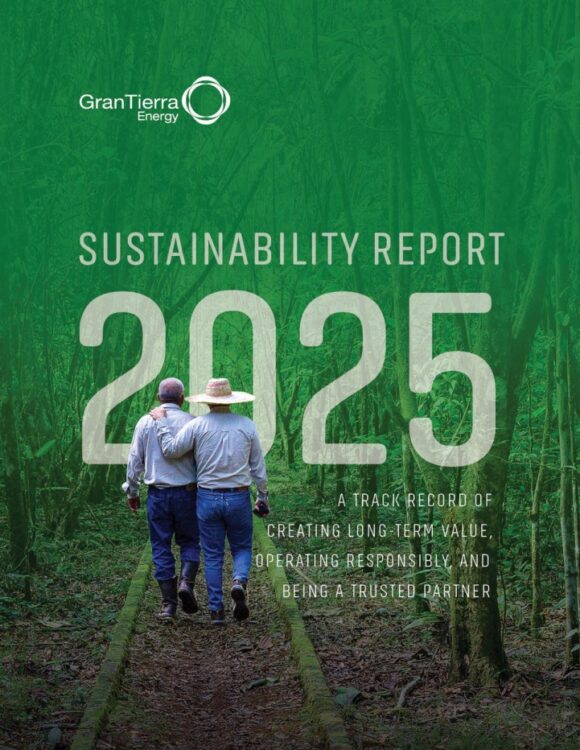
Sustainability Reports
SWIPE FOR MORE
Sustainability Report
GTE is committed to sustainable activities wherever the Company operates by providing meaningful training and employment opportunities, a preference for local goods and services, and by investing voluntarily in social and environmental projects.
This is a fundamental philosophy that we align with the priorities of local and national governments for peace and stability that prioritize strengthening local economies, entrepreneurship, housing and incomes unrelated to the oil industry.
- Economy Data
INDICATOR UNITS 2022 2023 2024 2025 Economic Value Generated and Distributed1 millions of $ 789.0 748.0 689.6 713.0 Payments to Suppliers, Contractors and Other Third Parties millions of $ 522.0 452.0 490.0 530.0 Payments to Governments (Taxes, Royalties) millions of $ 314.0 274.0 213.8 122.0 Payments to Employees (Salaries and Benefits) millions of $ 20.0 23.0 43.1 51.0 Investment in Communities millions of $ 8.0 11.0 11.4 7.1 Payments to Providers of Capital (Debt, Interest, Dividends) millions of $ 0.0 0.0 0.0 1.0 Social Investment millions of $ 5.1 6.5 7.0 6.5 Temporary Local Employment contracts 4,578 5,748 5,932 4,549 Spending on Suppliers (Colombia and Ecuador) millions of $ 295.6 459.8 528.2 485.5 Regional millions of $ 40.5 103.8 99.7 100 Country millions of $ 247.8 353.1 367.7 322 International millions of $ 7.3 2.9 1.5 6
- Human Resources Data
INDICATOR UNITS 2022 2023 2024 2025 Total Number of Employees count 336 351 431 470 Female count 125 128 165 186 Male count 211 223 266 284 Employees in Each Country Colombia count 235 234 243 248 Canada count 96 94 146 165 Ecuador count 5 23 42 57 Employees Covered by Collective Bargaining Agreements % 0 0 0 0 Rate of New Employee Hires2 % 11.0 12.0 29.23 12.74 Voluntary Turnover Rates2 % 4.2 4.0 4.41 3.18 Total Number of Hours of Training in the year (Colombia and Ecuador) hours 5,551 8,721 3,044 3,024 Average Hours of Training per Year per Employee (Colombia Only) hours/person 23.5 36.5 12.02 8.57 Average Hours of Training per Year per Employee (Ecuador Only) hours/person 2.5 6.1 3.40 24 Average Age of Employees (Colombia) years 41 42 43 44 Average Age of Employees (Canada) years 46 46 46 46 Average Age of Employees (Ecuador) years 46 37 39 41
- Safety Data
Indicator UNITS 2022 2023 2024 2025 Employee and Contractor Safety per 200,000 exposure hours Lost Time Injury Frequency - Combined 0.06 0.00 0.00 0.00 Recordable Injury Frequency - Combined 0.08 0.04 0.03 0.02 Recordable Injury Frequency - Employees 0.00 0.00 0.00 0.00 Recordable Injury Frequency - Contractors 0.08 0.04 0.03 0.02 Lost Time Injury Frequency - Employees 0.00 0.00 0.00 0.00 Lost Time Injury Frequency - Contractors 0.06 0.00 0.00 0.00 Fatalities - Employees count 0 0 0 0 Fatalities - Contractors count 0 0 0 0 Hours Worked hours 10,038,299 10,563,154 11,440,456 10,740,675 Public Safety and Emergency Preparedness Safety Inspections Conducted count 7,185 5,490 6,338 9,688 Number of Emergency Simulations (Tabletop and In-person) count 408 487 448 387
- Environment Data
INDICATOR UNITS 2022 2023 2024 2025 Total Number of Spill Incidents (Colombia and Ecuador)2 count 87 59 71 62 Contained Discharges2 count 60 55 41 52 Environmental Incidents2 count 20 3 9 2 Oil or Chemical Spills < 1 bbl2 count 7 1 14 8 Oil or Chemical Spills > 1 bbl2 count 0 0 7 0 Spills caused by third parties (vandalism, theft, or tanker truck accidents)2 count 0 8 9 2 Volume of Spills 2,4 m3 11.1 5.0 13.5 11 Aggregate Quantity of Significant or Reportable Spills2 m3 0 0 7.60 0 Water Withdrawal2 thousand m3 1,150.31 1,280.27 1,341.34 839.54 Water from Rivers and Creeks2 thousand m3 854.81 949.11 1,070.47 676.07 Water from Third Parties2 thousand m3 276.54 311.08 251.72 149.29 Water from Wells2 thousand m3 18.96 20.08 18.66 14.18 Water Discharged2,5 thousand m3 105.86 74.04 118.92 106.96 Other Water-related Measures Produced Water2 thousand m3 8,918.41 11,142.98 13,539.92 12,895.57 Water Injected into Active Wells2 thousand m3 8,622.08 10,804.15 11,925.60 11,124.00 Non-Enterprise Water Consumption (Head Office) thousand m3 3.10 2.99 4.89 5.32 Total Water Consumed2 thousand m3 1,044.45 1,206.23 1,222.42 732.58 Total GHG Emissions (CO2E)2,6 metric tonnes CO2e 710,034 727,358 726,284 631,821 Scope 1 metric tonnes CO2e 550,380 525,533 499,754 432,256 Scope 2 metric tonnes CO2e 159,654 201,825 226,530 199,565 Regulatory Compliance Number of Inspections by Authorities2 count 86 64 193 181 Number of Findings and Non-Compliances2 count 6 4 55 27 Number of Findings that Resulted in Fines or Non-Monetary Sanctions2 count 0 0 0 0 Incidents of Non-compliance with Water Quality or
Quantity Permits, Standards, or Regulations2count 0 0 1 0 Total Waste2 tonnes 1,541 5,546 11,506 10,635 Hazardous Waste (as defined in the Country)2 tonnes 1,124 5,226 3,939 3,735 Non-Hazardous Waste2 tonnes 417 320 7,567 6,900 Non-Hazardous Waste Include Percentage of Waste Recycled2 % 36 7 2.83 2.65 Non-Hazardous Waste Include Percentage of Waste Incinerated2 % 0 0 0.54 0.37 Non-Hazardous Waste Include Percentage of Waste Landfilled2 % 64 93 97 97 Energy Derived from Renewable and Non-Renewable Sources2 kWh 257,075,796 325,070,749 423,352,006 766,996,499 Energy Purchased2 kWh 29,377,750 32,681,004 40,483,753 73,907,080 Total Energy Consumption Within the Organization2 kWh 286,453,546 357,751,753 463,835,759 840,903,579
Total Energy Consumption That is Derived from Non-renewable Sources (Fossil Fuels)2
kWh261,362,010 332,613,525 438,933,769 802,811,916 Total Energy Consumption That Is Derived from Renewable Sources2 kWh 25,091,536 25,138,228 24,901,990 38,091,663 Percentage of Energy Used That Is Derived from Non-Renewable Sources2 % 91.2 93.0 94.6 95.5 Percentage of Energy Used That Is Derived from Renewable Sources2 % 8.8 7.0 5.4 4.5 Percentage of Consumed Energy from the Grid2 % 10.3 9.1 8.7 8.8
- Communities and Human Rights Data
INDICATOR UNITS 2022 2023 2024 2025 Total Number of Grievances count 1,485 1,461 1,527 1,525 Resolved count 1,485 1,461 1,527 1,525 In Progress count 0 0 0 0 Grievances by Type/Subject Labour Practices count 286 230 205 230 Environmental Impacts count 105 119 106 104 Procurement of Goods and Services count 177 165 188 258 Land Access count 22 30 41 43 Human Rights count 0 1 1 3 Other Causes (Impacts on Third Parties, Infrastructure) count 857 916 986 887 Total Number of Active Prior Consultations count 16 13 6 9 Total Number of Prior Consultations Concluded count 7 3 0 1 Number of Ethnic Communities Consulted count 16 13 6 9
-
VIEW FOOTNOTES
-
All monetary values are in USD. Figures may differ slightly due to rounding. Please note, certain data points for previous years have been restated as Gran Tierra works to enhance its data collection approach and alignment with leading ESG reporting frameworks. Certain scope, boundaries, definitions, and calculation methods may have been updated and refined.
1. Total includes all Capex, Opex, G&A, Acquisitions, Taxes and Royalties in 2025.
2. Includes Canada, Colombia, and Ecuador data for 2025.
3. Includes the volumes from all four types of spills except those caused by third parties.
4. No untreated wastewater is discharged.
5. Calculations are made under the Operational Control Boundary.

SASB Report

ESTMA Reports

Forced Labour Report
Our Approach to Responsible Sustainability
Creating long-term value & delivering on our environmental, social & governance commitments
ESTMA Reporting
Forced Labour Reporting
Learn More About Gran Tierra Energy
In addition to our general website disclaimer, note that the statements on this site are drawn from various sources which despite adequate and proper efforts may contain inaccuracies.